- • Requirements for the controlled devices
- • Dashboards, Zones, Categories
- • Simple thermostat with hysteresis
- • Simple Heating management using Weekly schedule and Presence switch
- • Power limiting
- • Notification on high temperature (DEPRECATED)
- • Configuring hysteresis control via Equation Smart Rule
- • PID Temperature regulation
- • PID Cascade
- • Regulation of Boiler Cascade
- • Equithermic regulation
- • Heating control in high electricity tariff via load management tariff indicator input
- • Heating and Cooling modes
- • Editing multiple devices at once
- • Setting the response speed of push buttons
- • Integrate multiple control units Core
- • Safe values
- • How to combine two daily schedules in one day
- • Linking devices together
- • Device log
- • Using statistic values in Smart Rules
- • Hot water circulation pump control
- • Exporting data from TapHome into Google Spreadsheet using Integromat
- • Exporting device descriptions
- • 2025
- • 2024
- • 2023
- • 2022.2
- • 2022.1
- • 2021.3
- • 2021.2
- • 2021.1
- • 2020.1
- • 2019.1
- • 2018.1
- • 2017.1 - Blinds automation - angle control update
- • 2017.1 - Blinds automation - Depth of sun rays
- • 2017.1 - Charts updated
- • 2017.1 - Core update from the app
- • 2017.1 - Double click and triple click
- • 2017.1 - Expose devices
- • 2017.1 - Multi-value switch
- • 2017.1 - Permissions
- • 2017.1 - Replace module action
- • 2017.1 - Set to Automatic mode - "Push buttons event" Smart Rule
- • 2017.1 – Daily schedule Smart Rule
- Documentation
- Initial setup
- Bus analyzer
Bus analyzer

For better diagnostic of TapHome bus there is possible to use Bus analyzer. Go to Settings/Hardware/TapHome Bus and click on Bus analyzer:

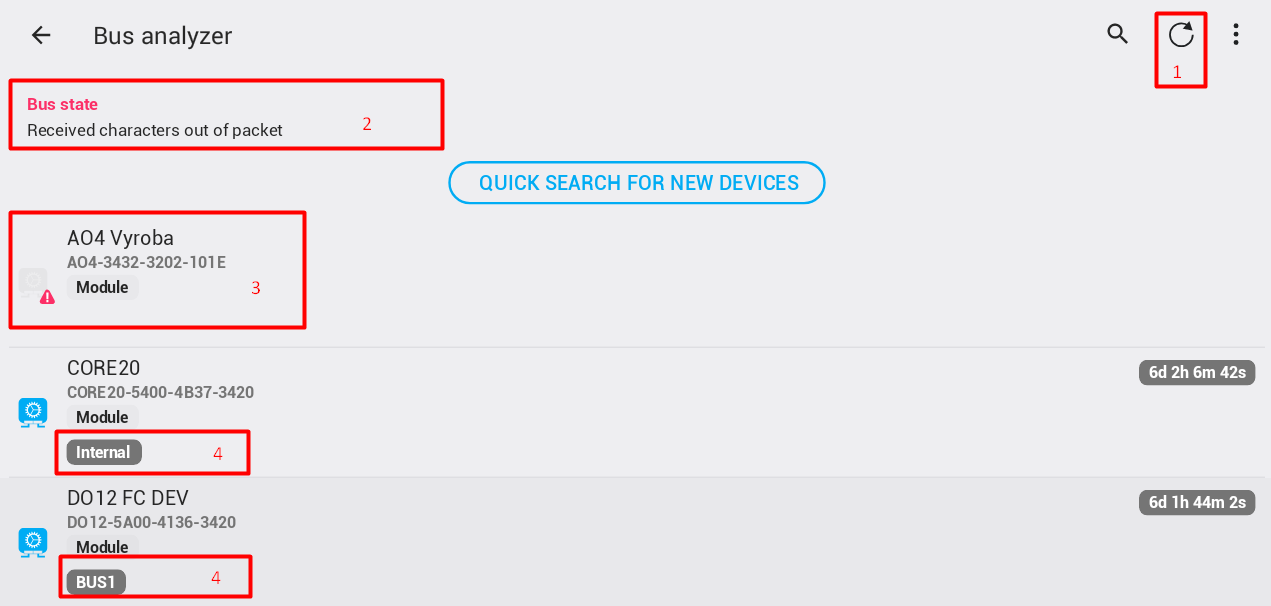
Bus analyser page:

If the communication with module is actually wrong - module do not answer - then this information is displayed in red colour:

If there were communication problems, but actually module answering correctly errors are displayed in green colour:

If there are possibly unexpected module information's - like unexpected reset - this is displayed near to module name in red colour:

If the uptime of the module is more then 30 seconds but less than 2 minutes it is displayed in green colour:

If the uptime of the module is less than 30 seconds it is displayed in red colour:

After two minutes from start uptime is displayed in gray colour.
Click on reset error statistic button will clear all module communication errors from memory and starts new statistics. This can be used after finding out some problems to focus on just new problems which appears on bus after this. Until statistics are reset every time when bus analyzer is started they are displayed also for communication which was before bus analyzer starts.
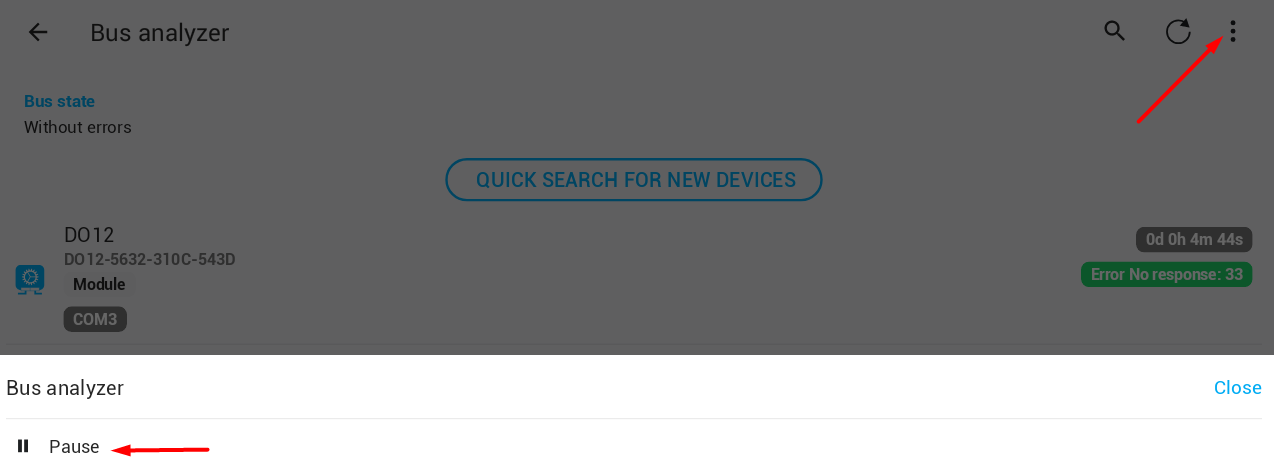
There is possible to pause the bus analyzer and check the actual state without changes. Use following click to do so:

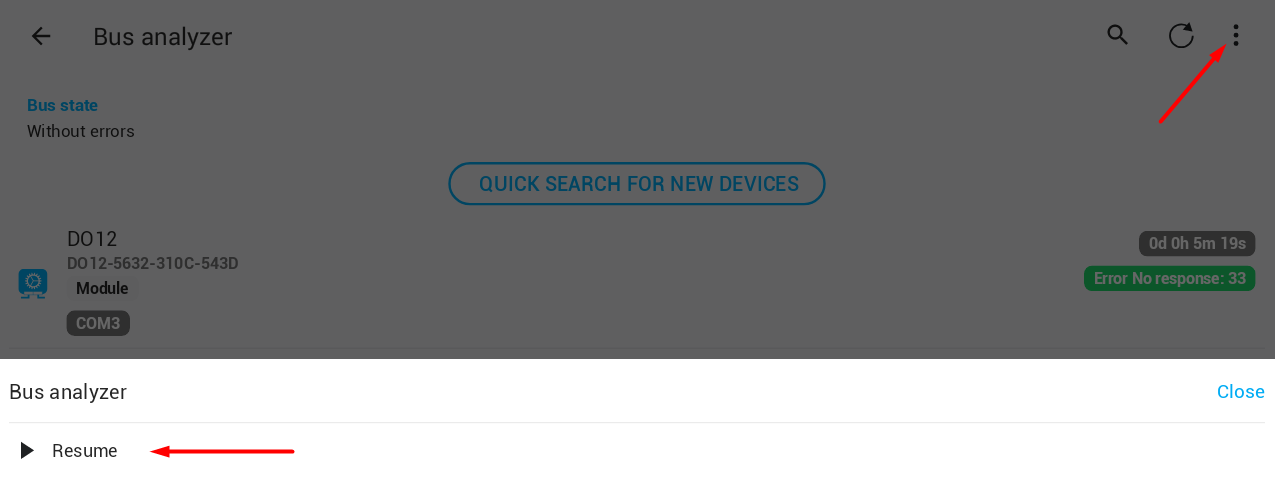
To again run live display use resume:

Bus analyzer include possibility to quick search for new devices. When this is started there is only one cycle of new devices finding cycle executed - in normal operation there are three cycles done.
Please note that Bus analyzer use extensive communication with modules which can slow down normal operation. After you either correctly close Bus analyzer or any how finish TapHome application the Bus analyzer is no more active.