
Message log for Packet Parser and MQTT: see what a module sent and received
A short record of the messages a Packet Parser module sends and receives, with time, direction, MQTT topic or address and content, shown in its service settings while you troubleshoot. No network sniffer needed, and only the module's own messages, not the whole network.
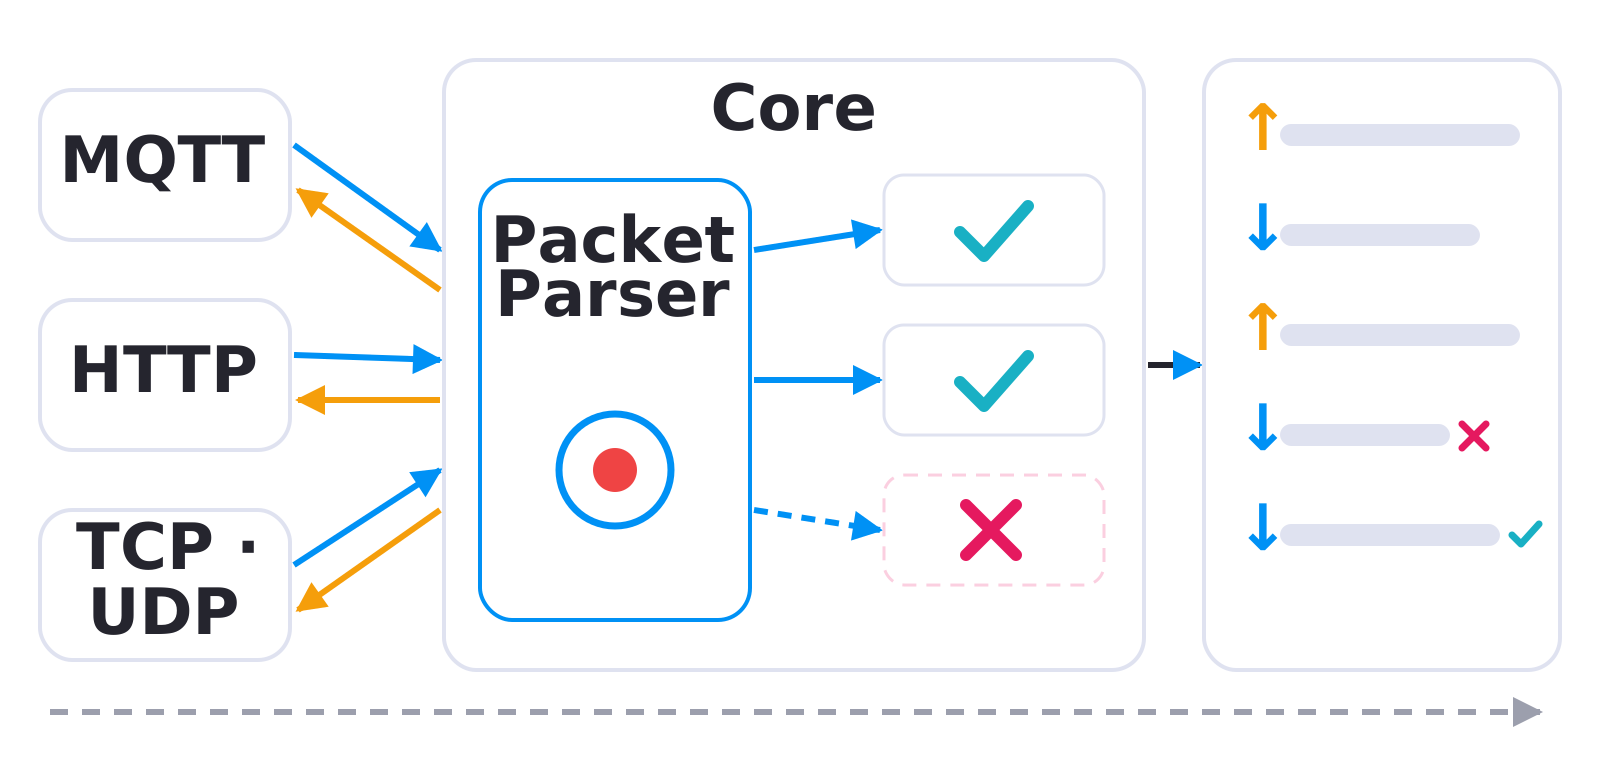
Why and how you would use it
Packet Parser connects third-party devices to the Core over HTTP, TCP, UDP, FTP and MQTT. When a value does not arrive, or arrives far more often than it should, the installer needs to see the messages themselves: what came in, on which topic, with what content, and what the Core sent out. Today the service settings of a Packet Parser module show statistics: how many messages were received and sent in the last 5 and 30 minutes, how many bytes were received and, for MQTT, the messages per topic. They tell you that something arrives, not what it is or which device sent it.
A typical case: an installer watches the MQTT broker and sees the state of one lamp every few seconds, sometimes several times a second, although it should be written once a minute. Is the Core sending it, or another system? If it is the Core, which device and which script? Today that needs a network sniffer or a desktop MQTT client next to the installation. Another case: a newer generation of a device publishes under other topics than the listener script expects. The value stays empty and the app shows no error, because nothing that matches ever arrives.

The record would show both cases at a glance. In this draft, the write script of a lamp sends the same message every second, and a message on another topic is marked as not processed, so no device reads it.
| Today | With this idea | |
|---|---|---|
| Messages per topic | Counts only | Counts and content |
| Content of a message | Separate tool | Service settings |
| Who sent it | Not visible | Device and script |
What will be possible
We are evaluating this idea. Nothing below is scheduled yet, and the details may still change.
- Record on demand. You would start the record in the service settings of a Packet Parser module for a limited time while you troubleshoot, and open it in its own window on a computer. It would stop by itself, and nothing is recorded while it is off.
- Both directions. Every line would carry the time to the millisecond, the direction (received or sent), the MQTT topic or the address and port, the size and the content, as text or as bytes.
- Which device used it. For a received message, the record would show which devices of the module processed it, or that none did: a topic that no listener script reads. For a sent message, it would show the device and the script that sent it, for example a write script with MQTTPUBLISH.
- Each protocol in its own terms. MQTT: topic and content of the message. HTTP: method, path, status code, response time and a shortened body. TCP and UDP: the data sent with SENDDATA and the data received. FTP: file name, size and result, not the file itself.
- Connection events. Connected, disconnected and failed to connect, with the reason and the address of the broker or device.
- Passwords hidden. Authorization headers, cookies, user names, passwords and tokens in addresses would be masked before they are written. The record would stay in the memory of the Core: it would not be sent to the cloud, not be part of a backup, and it would be gone after a restart.
What will not be possible
- Capturing the whole network. The Core would not capture all traffic on its network port or produce a file for Wireshark. Such a capture would carry the traffic of every device in the home, including the passwords of other systems.
- All traffic of the MQTT broker on the Core, in a first version. The record would carry what the Packet Parser module itself sends and receives. Messages that other devices exchange through the broker on the Core, without any TapHome module subscribing to them, would not be in it.
- A long history. The record would keep the last few hundred messages and shorten long content. It is a troubleshooting tool, not a permanent log.
- Messages from before the start. What arrived before you started the record, for example right after the Core restarted, would not be in it.
- Other integrations. Modbus, the TapHome bus, Zigbee and other integrations are not part of this idea.
How to solve it today
- Statistics in the service settings. Open the service settings of the Packet Parser module and compare the counts of received and sent messages and, for MQTT, the topics. A topic you did not expect shows that the device publishes under another name; a topic with many messages is a reason to narrow the topic filter, see Packet analysis.
- Check the topic first in the listener script. Compare
RECEIVEDMSG.Topicbefore you read the content, so that messages you do not need cost almost nothing, see Listener script. - An MQTT client on a computer. Connect an MQTT client (for example MQTT Explorer) to the same broker, also the MQTT Broker on the Core, and subscribe to the topic of the device or to
#. It shows every message with its time and content. - A mirror port on a switch. For HTTP, TCP and UDP, a managed switch can copy the traffic of the Core’s port to a computer with Wireshark. The content of HTTPS stays encrypted.
How it could look

For an HTTP module, the record would pair each request with its answer, show the status code and the response time, mark errors such as a timeout, and hide the Authorization header. The pictures are a draft: the final screens may look different.
Learn more
- Packet Parser documentation.
- Listener scripts and the
RECEIVEDMSGobject. - MQTT Broker on the Core.
Which protocol do you troubleshoot most often, and what would you need to see in the record? Vote for this idea and follow it for updates.
Related
Status history
- Nov 4, 2026 Gathering interest Published
Comments 0
Sign in with your TapHome account to comment. The team approves comments before they appear.
No comments yet.
·
The original comment was deleted.
Ideas describe direction, not commitments. We do not publish dates; released features are announced in the release notes.
Sign in with your TapHome account to follow. We email you when something changes; unsubscribe in one click.
Confirming your vote…